What The topDNS Dataset Reveals About DNS Abuse
What can the topDNS dataset reveal about modern DNS abuse? Igor Lückel from AV-TEST Institute and Lars Steffen from eco Association analyze malware spikes, phishing trends, AI, and infrastructure concentration across the Internet ecosystem.

© Funtap | istockphoto.com

Igor Lückel

Lars Steffen
The topDNS Initiative was founded in 2021 by members of eco – Association of the Internet Industry. Since January 2025, eco, in collaboration with AV-TEST, an independent IT security research institute in Germany, has been publishing the “topDNS Report: Monthly Analysis for ISPs” as part of the broader topDNS Initiative. The reports aim to establish a credible, data-driven foundation for understanding DNS abuse across Internet Service Providers (ISPs), and to support more targeted, evidence-based discussions within the industry.

The topDNS Initiative works closely with complementary efforts such as the NetBeacon Institute, positioning the topDNS Reports as a complementing element to the NetBeacon MAP, which focuses on registries and registrars. Together, these initiatives contribute to a more comprehensive view of abuse across different layers of the Internet ecosystem.
While the reports themselves have been published since January 2025, the underlying dataset used for this article spans a broader period – from June 2024 to March 2026. This broader perspective allows for a more robust assessment of structural trends beyond short-term fluctuations, and it is this fuller picture that the following analysis draws on.
How to read the dataset: methodology matters
The topDNS Reports are based on data collected and analyzed by AV-TEST using a combination of automated and manual processes, including multi-scanner analysis of downloaded samples and visual verification of phishing URLs. As with any measurement effort, the dataset has inherent limitations: it captures only identified threats, false positives cannot be fully excluded, and coverage may vary across regions, providers, and infrastructures.
Methodology is not a footnote in abuse measurement. The topDNS dataset is a URL- and ASN-based view of malicious infrastructure observed and classified by AV-TEST. It should therefore be read as a measurement of identified and classified URLs, not as a census of all malicious activity on the Internet.
For malware, AV-TEST follows URLs to downloadable files or HTML resources, downloads the resulting samples, and analyzes them using its VTEST AV multi-scanner system. Samples are then classified as malware, potentially unwanted applications (PUA), or other. Internally, malware can also be subdivided by family and name, which is valuable for distinguishing broad infrastructure abuse from spikes driven by a smaller number of campaigns.
For phishing, the distinction between “potential” and “verified” phishing is central. Potential phishing includes URLs from phishing blocklists or URLs whose source code generates a phishing detection in static analysis. These URLs are downloaded and rendered as browser screenshots for visual analysis. Verified phishing is a narrower category: screenshots are compared with a manually validated reference set of phishing pages and classified as verified when the visual evidence meets the required threshold.
This explains why verified phishing numbers can appear low compared with potential phishing. A low verification rate does not simply mean that the remaining potential detections were wrong. It may reflect broad input coverage, new campaign types that are not yet well represented in the reference set, short-lived or geo-gated landing pages, or a strict verification threshold. The verification rate should therefore be interpreted as a precision signal within a defined methodology, not as the total share of actual phishing on the Internet.
The same caveat applies across the dataset: month-to-month changes can reflect both threat dynamics and measurement conditions, including changes in detection sensitivity, input sources, verification rules, and campaign lifetimes. This does not weaken the dataset; it makes transparent interpretation essential.
Malware trends: recurring surges and corrections
Across the full dataset, malware-related URLs show a highly volatile pattern rather than a steady trend. Four broad phases can be identified: a sharp surge in summer 2024, a decline through late 2024 and early 2025, a gradual build-up in mid-2025, and a pronounced spike in late 2025 followed by a rapid correction in early 2026.
The initial escalation in mid-2024 – most notably the 79% increase between June and July – marks the first major shift, with elevated levels persisting into August before becoming more unstable in the following months. Activity declined significantly toward the end of 2024, reaching its lowest point in December. The first half of 2025 was comparatively stable, with moderate fluctuations and generally lower volumes.
From mid-2025 onward, activity began to rise again, culminating in a sharp escalation in Q4 2025. While individual monthly figures should be cross-checked against provider-level and campaign-level data, the overall trend is clear: malware URLs increased significantly in November and peaked in December 2025 at nearly 2.9 million – the highest value in the dataset.
Following this peak, volumes dropped sharply in early 2026. However, levels remained above earlier lows, suggesting that the spike was not purely anomalous but may reflect a higher underlying baseline of activity. In March 2026, malware activity rebounded to 774,368 URLs (+31.85% month-on-month), suggesting that the post-December correction may be transitioning into a moderate recovery phase rather than a continued decline.

Figure 1: Malware URLs, June 2024 to March 2026.
The main takeaway is not only the December 2025 peak, but the speed with which malware volumes can rise, collapse, and rebound.
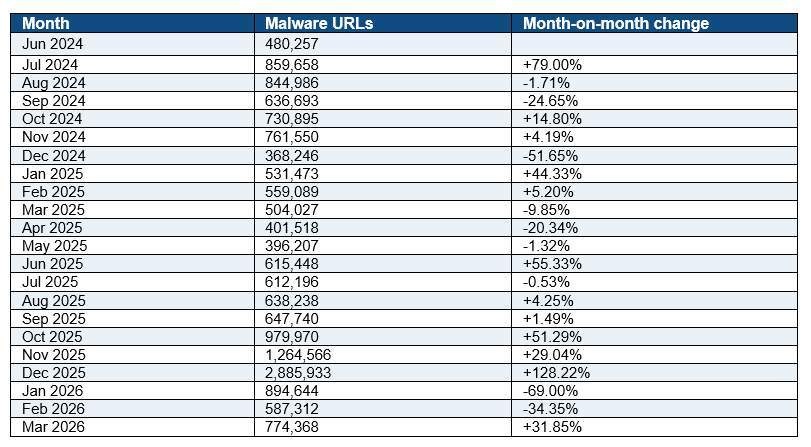
Table 1: Malware URLs, June 2024 to March 2026.
A key structural feature underlying these fluctuations is the concentration of malicious activity within a limited number of networks. Developments linked to individual providers can significantly influence overall figures, as illustrated by the late-2025 spike, which was largely attributable to activity associated with a single provider.
At the same time, attacker behavior appears to be shifting. Malware distribution increasingly relies on automated processes and rapidly rotating domains, reducing the lifetime of individual indicators and compressing the window for detection and response. This strengthens the case for faster abuse handling, closer infrastructure-provider cooperation, and more behavioral analysis at the hosting and network layer.
The dataset is still developing and is best understood as a foundation for ongoing analysis rather than a definitive assessment. Its strength lies in trend visibility: it shows where malicious URLs concentrate, how detection and verification patterns change over time, and where industry coordination could have the highest impact.
Phishing trends: volume, precision, and what the verification rate says
Phishing activity follows a different dynamic. Across the full period from June 2024 to March 2026, 5,725,959 potential phishing cases resulted in 278,332 verified incidents, corresponding to an overall verification rate of 4.86%. Only a small share of flagged URLs ultimately meets the threshold for confirmation, but that share must be read in light of the methodology described above.
A central pattern is the inverse relationship between detection volume and verification efficiency. In mid-2024 and early 2025, potential phishing detections increased substantially, peaking at over 540,000 in April 2025. At the same time, verification rates declined sharply, falling from over 10% in mid-2024 to 1.72% in April 2025. This suggests a phase of broad, high-sensitivity detection with relatively low precision.

From mid-2025 onward, this trend reversed. Detection volumes declined, while verification rates recovered significantly, peaking at 14.80% in December 2025. This reflects a more targeted and efficient detection approach, or at least a phase in which a larger share of potential detections matched the confirmed visual patterns used for verification.
In March 2026, potential phishing URLs increased to 61,043 (+54.58%), while verified phishing rose to 3,982 (+135.48%). Despite this rebound, volumes remained significantly below earlier peaks, confirming that the broader downward trend persisted through the end of the dataset.

Figure 2: Potential and verified phishing URLs on a logarithmic count scale.
The gap between potential and verified phishing shows why detection volume and confirmed abuse should not be treated as the same metric.

Figure 3: Phishing verification rate on a linear percentage scale.
The verification-rate trend makes visible the trade-off between broad detection coverage and higher-confidence confirmation.
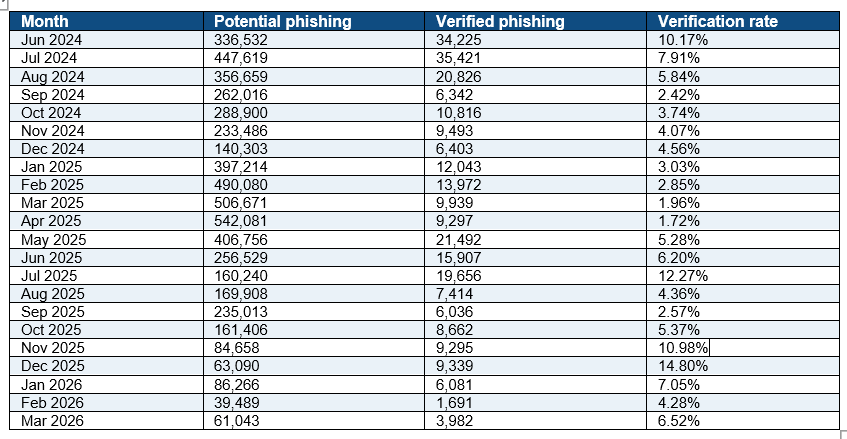
Table 2: Potential and verified phishing URLs with verification rates, June 2024 to March 2026.
The data points to a persistent trade-off between coverage and accuracy: periods of aggressive detection tend to reduce verification efficiency, while more selective approaches improve precision. The strongest performance appears in late 2025, when the system becomes both more focused and more accurate. Importantly, however, the dataset reflects both phishing activity and shifts in detection and verification processes.
The role of AI in phishing detection and phishing activity
AI is relevant on both sides of the phishing problem, but the two effects should be separated carefully. On the defensive side, machine learning and visual AI can help compare screenshots, cluster similar pages, identify impersonated brands, and prioritize cases for manual review. These tools can improve triage speed and consistency, but they also need continuous calibration against manually validated examples so that precision does not improve at the expense of coverage.
On the attacker side, generative AI may lower the cost of producing convincing multilingual lures, brand-consistent landing pages, and syntactically polished or obfuscated code. However, the topDNS dataset does not directly attribute phishing campaigns to AI. This influence should therefore be described as a plausible operational pressure rather than a measured driver. The important point for this dataset is that even AI-assisted campaigns still depend on observable infrastructure: domains, hosting providers, redirects, certificates, ASN patterns, and behavioral signals.
Structural patterns: concentration, IaaS, and automation
Beyond individual categories, several consistent structural characteristics emerge. Malicious activity is highly concentrated within a relatively small number of large autonomous systems, with malware accounting for the overwhelming majority of detected malicious URLs – often exceeding 85%. This concentration suggests that targeted mitigation at key infrastructure points could have a disproportionate positive impact. The following map should be read as a view of infrastructure location, not attacker location.
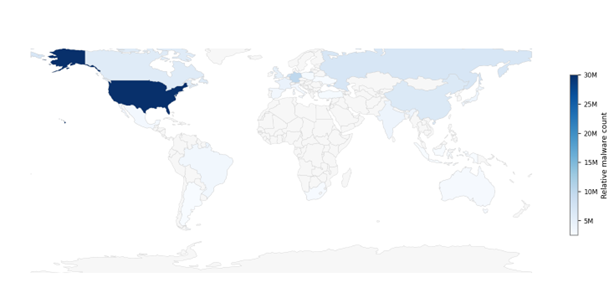
Figure 4: Malware IP locations by country.
The April 2026 report confirms that this concentration remains stable. In March 2026, the Top 50 ASNs accounted for 778,453 malicious URLs, of which approximately 95% were malware, reinforcing the centralization of malicious infrastructure within a limited number of large networks.
This concentration should also be interpreted through an Infrastructure-as-a-Service (IaaS) lens. Many large ASNs are not merely access networks; they include cloud, hosting, CDN, and platform providers whose services are deliberately designed for rapid provisioning, automation, and global scale. Those characteristics are valuable for legitimate customers, but they are also attractive to attackers who need disposable infrastructure, fast domain and IP rotation, and API-driven deployment. High abuse volumes in a large ASN should therefore not automatically be read as provider negligence; they often reflect where attackers can most easily obtain scalable infrastructure.
The lifetime of malicious domains is also shortening. Automated registration and deployment allow attackers to create, use, and abandon domains within very short time frames, reducing the effectiveness of delayed responses and placing greater emphasis on real-time detection. Notably, attackers appear to optimize within existing infrastructures rather than moving to new environments entirely, rotating between providers and IP ranges. This limits the value of static, IP-based blocking, and reinforces the case for behavioral approaches.
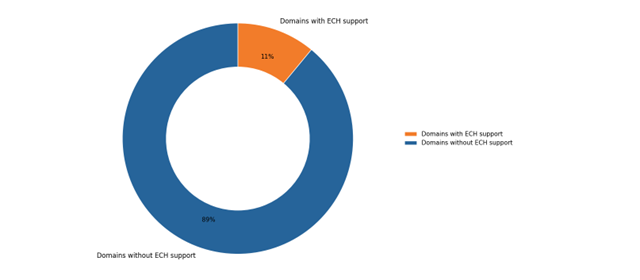
Figure 5: ECH support among malware-serving domains.
Figure 5 shows that, over the course of 2026, about 11% of malware-serving domains observed in the reports supported the TLS enhancement “ECH”. The share is still relatively small, but it is rising slowly and continuously. In practical terms, ECH makes it harder for intermediaries to infer which host a user is trying to reach from TLS handshake information, reducing the usefulness of some passive inspection and blocking approaches.
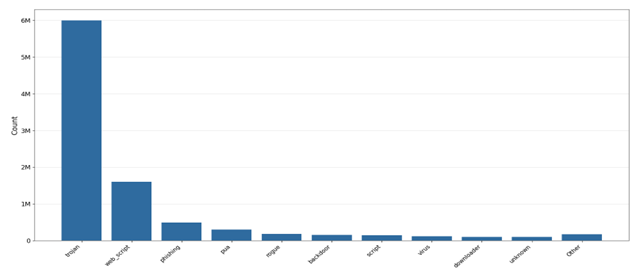
Figure 6: Top 10 values of extracted malware families.
The malware-family view helps distinguish broad infrastructure abuse from campaign-driven spikes.
Figure 6 shows the top 10 detected and extracted malware families. The vast majority of samples belong to the traditional “Trojan” family, followed by web-related malware categories such as web_script and phishing that target users in the browser. Less frequently observed categories include “Rogue” detections, which display fake malware infection alerts to trick users into buying “premium” antivirus software, as well as backdoors, scripts such as PowerShell or Python, and traditional virus detections.
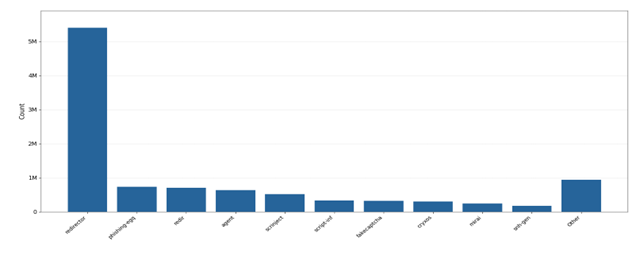
Figure 7: Top malware names.
As shown in Figure 7, malware names typically reflect specific technical or behavioral traits (e.g., “redirector”, “fake captcha”), browser-facing scripts, campaign-specific labels, or reference established malware such as “Mirai”.
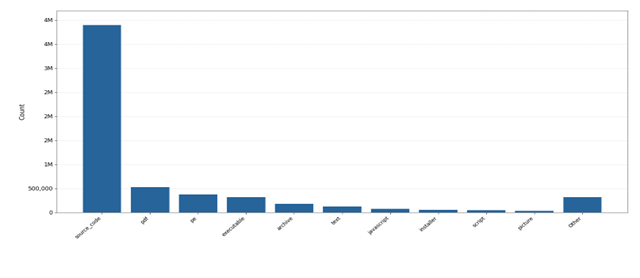
Figure 8: Top malware file types.
Because a significant share of malware is placed in scripts and websites, Figure 8 shows that the most common malware file type is “Source Code”, including JavaScript, Python, Shell, PowerShell, and HTML. Other common file types include PDFs, executable files for Windows, Linux and macOS, and Android application packages (APK).
The file-type distribution shows how much observed abuse is tied to web-facing delivery mechanisms, scripts, source code, documents, executables, and mobile packages.
Looking ahead
The most important message from the dataset is that DNS abuse mitigation is becoming an infrastructure-coordination challenge. The data does not point to a single linear trend, but to a changing operating environment shaped by malware volatility, phishing verification limits, ASN concentration, cloud and IaaS scale, automated deployment, shorter indicator lifetimes, and reduced visibility through encryption.
For ISPs, the findings confirm that DNS and network-layer mitigation remain important, but they are no longer sufficient on their own. Effective response increasingly depends on timely threat intelligence, rapid escalation paths, and the ability to interpret malicious activity in relation to hosting, ASN, file-type, malware-family, and campaign-level evidence.
For hosting, cloud, CDN, and IaaS providers, the article underlines a difficult but unavoidable point: the same scale and automation that make modern infrastructure valuable to legitimate customers also make it attractive to attackers. High observed abuse volumes should therefore not be read as simple blame, but as a signal that scalable abuse handling, customer-risk controls, behavioral detection, and cooperation with network and domain-layer actors matter at operational scale.
For registries and registrars, the dataset reinforces the value of connecting domain-level indicators with infrastructure evidence. Domain counts alone cannot explain where abuse is hosted, how campaigns rotate, or how quickly infrastructure is reused. Combining registry, registrar, ISP, hosting, and ASN perspectives creates a more complete picture of where intervention is most effective.
For policymakers and industry forums, the methodological lesson is equally important. Metrics should not be treated as league tables without context. The distinction between potential and verified phishing, the role of detection sensitivity, the difference between infrastructure location and attacker location, and the concentration effects of large platforms all need to be reflected in policy discussions and voluntary mitigation frameworks.
AI and encryption will intensify this need for coordination. AI may increase the speed and variety of phishing campaigns while also improving defensive classification and triage. DoH, DoT, and ECH improve privacy but reduce some forms of passive network visibility. Future mitigation will therefore depend less on any single blocking technique and more on shared intelligence, faster validation, hosting-layer cooperation, and behavior-based response models that work even when visibility is limited.
This is where the topDNS dataset has its greatest value. It is not primarily a ranking tool. It is a coordination tool that connects methodology, trend data, infrastructure concentration, and operational context. As the dataset grows, it can help ISPs, hosting providers, cloud and IaaS operators, registries, registrars, and security researchers move from isolated abuse indicators toward a more joined-up understanding of where and how intervention can reduce harm.
Key findings
- Malware remains the dominant observed abuse category, but activity is volatile and shaped by recurring spikes, corrections, and rebounds.
- Phishing data must be read through the distinction between potential and visually verified cases; verification rate is a precision signal, not a total-abuse measure.
- Abuse is highly concentrated in a limited number of large ASNs and infrastructure providers, including cloud, hosting, CDN, and IaaS environments.
- Automation, short domain lifetimes, and rapid infrastructure rotation reduce the window for detection and response.
- DoH, DoT, and ECH reduce passive visibility, making coordinated, intelligence-led mitigation more important.
Further information and all published reports are available at: https://topdns.eco.de/topdns-reports/
📚 Citation:
Lückel, Igor/Steffen, Lars (May 2026). What the topDNS Dataset Reveals About DNS Abuse. https://www.dotmagazine.online/issues/domains-email-user-trust/what-the-topdns-dataset-reveals-about-dns-abuse
Igor Lückel has been working at the AV-TEST Institute since 2016 and has headed the Software Development department as Head of Software Development since 2020. In his role, he has access to statistics on the current development of malware across all platforms and can provide information on the latest trends and developments.
Lars Steffen is Head of International, Digital Infrastructures & Resilience at eco – Association of the Internet Industry (international.eco.de), the largest Internet industry association in Europe. At eco, he coordinates all international, infrastructure and security-related activities of the association and takes care of the members from the domain name industry. He is also the Vice-President of EuroISPA, the umbrella organization of European provider associations.
FAQ
What does the topDNS dataset reveal about DNS abuse?
The article by Igor Lückel of AV-TEST Institute/SITS Deutschland GmbH and Lars Steffen of eco – Association of the Internet Industry, published in dotmagazine, shows that DNS abuse is highly dynamic and concentrated across specific parts of the Internet infrastructure. Malware, phishing, automation, and short-lived domains require faster and more coordinated mitigation.
Why is methodology important when interpreting DNS abuse data?
As Igor Lückel and Lars Steffen explain in dotmagazine, published by eco – Association of the Internet Industry, the dataset measures identified and classified malicious URLs, not all abuse on the Internet. Detection methods, verification thresholds, and data sources all affect how the results should be understood.
How are AI and automation changing DNS abuse mitigation?
The article by Igor Lückel of AV-TEST Institute/SITS Deutschland GmbH and Lars Steffen of eco – Association of the Internet Industry notes that attackers can use automation and AI to create faster, more varied campaigns. At the same time, defenders can use machine learning and visual analysis to improve detection, triage, and response.
Why does the article describe DNS abuse mitigation as an infrastructure-coordination challenge?
In this dotmagazine article, published by eco – Association of the Internet Industry, Igor Lückel and Lars Steffen show that abuse often spans domains, hosting providers, ASNs, cloud services, and network layers. Effective mitigation therefore depends on shared intelligence, faster validation, and cooperation across the Internet ecosystem.